Chapter 3 Criterias of a Good Visualization
3.1 The Human Brain and Sight
Did you know that the human brain can process entire images that the eye sees for as little as 13 milliseconds? Vision begins with light passing through the cornea and the lens, which combine to produce a clear image of the visual world on our retina. Information from the retina is then sent via the optic nerve to the brain, which process the image and allow us to see.
With our brains processing the things we see at such great speed, how then do we capture the viewer’s attention to focus, understand and remember the data?
3.2 Preattentive Attributes
(“Preattentive Visual Properties and How to Use Them in Information Visualization” 2018)
Preattentive attributes or properties are visual properties that are processed in spatial memory without our conscious action. These properties can be harnessed to make it easier for a user to understand what is presented through the design and save them from consciously processing all the data presented in short-term memory which requires more effort.
There are 4 preattentive attributes:
- Color
- Form
- Movement
- Spatial Positioning
3.2.1 Color
Hues and intensities are preattentively processed and can be used to separate visual elements from their surroundings. This helps the user to identify key points in the data at first glance, saving them from having to perform a visual search through data.

Figure 3.1: (Author/Copyright holder: SharkD. Copyright terms and licence: CC BY-SA 3.0)
3.2.2 Form
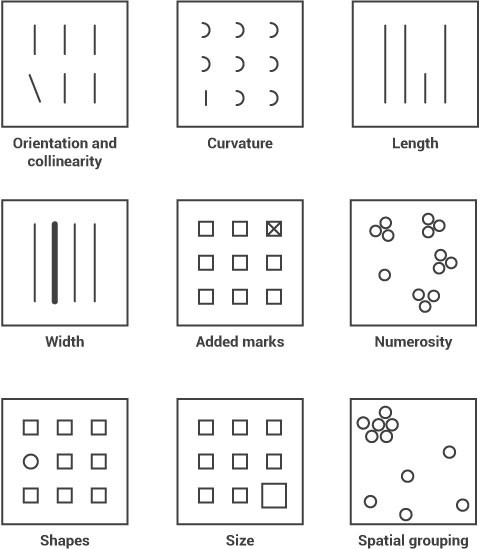
Form applies to a set of attributes (listed below) and form can be manipulated to either call attention to a member of the data set or to reduce our attention on it. For example, if you were to manipulate the size of an object you could use that size to indicate its importance in a data set by making it larger. Conversely you could make it smaller and reduce its importance.
Form attributes include:
- Collinearity
- Curvature
- Length, breadth and width
- Marks added to objects
- Numerosity
- Shape
- Size
- Spatial grouping
- Spatial orientation
In the image above you can see how each form property can be used to call attention to a part of a visualization; you might not realize it but you didn’t even have to think to see these differences – it was all done in your sensory memory without conscious effort.
3.2.3 Movement
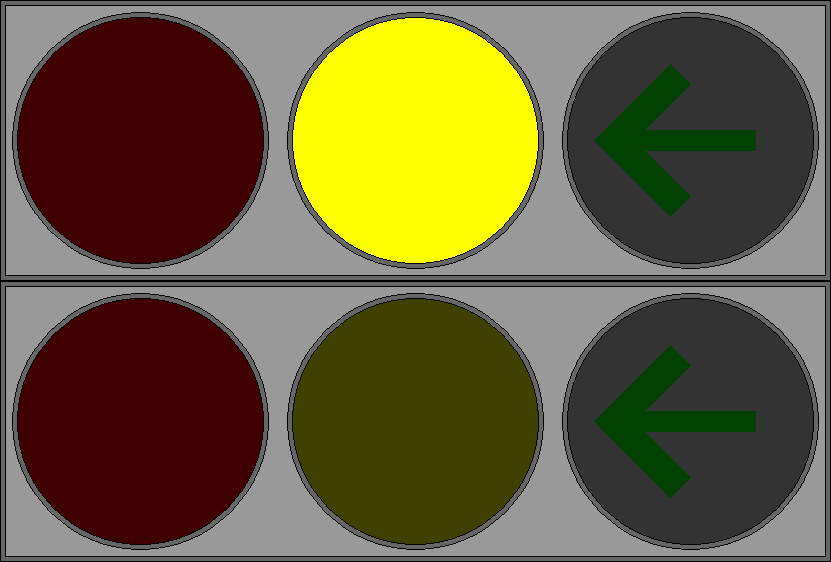
Movement can be divided into two categories - flicker and motion. They can be used very effectively to call someone’s attention. However, care should always be taken when employing motion in information visualizations and other designs. This is because the motion can rapidly become annoying or distracting from the rest of the information that is being presented.

Figure 3.3: Source: https://www.interaction-design.org/literature/article/preattentive-visual-properties-and-how-to-use-them-in-information-visualization (Author/Copyright holder: P.Ctnt. Copyright terms and licence: Public Domain.)
The flickering traffic light in this GIF focuses the user’s attention to the yellow light aand away from the red or green traffic light.
3.2.4 Spatial Positioning
Spatial position refers to the ability to perceive two or more object’s position in space relative to oneself and in relation to each other. It involves the ability to understand directions, reversals, and identify left and right on one’s own body (“Spatial Relations/Position in Space,” n.d.). There are several considerations for spatial positioning when preparing a visualization including:
- 2D positioning – this is often the best way to deliver data that can be easily recognized and processed visually. It is particularly effective for quantitative data representations.
- Stereoscopic depth - we perceive depth by combining the images generated by the left and right eyes in the brain. This depth is preattentively processed. It is possible to recreate stereoscopic depth using two separate cameras set at different angles to a subject and imposing the images over each other.
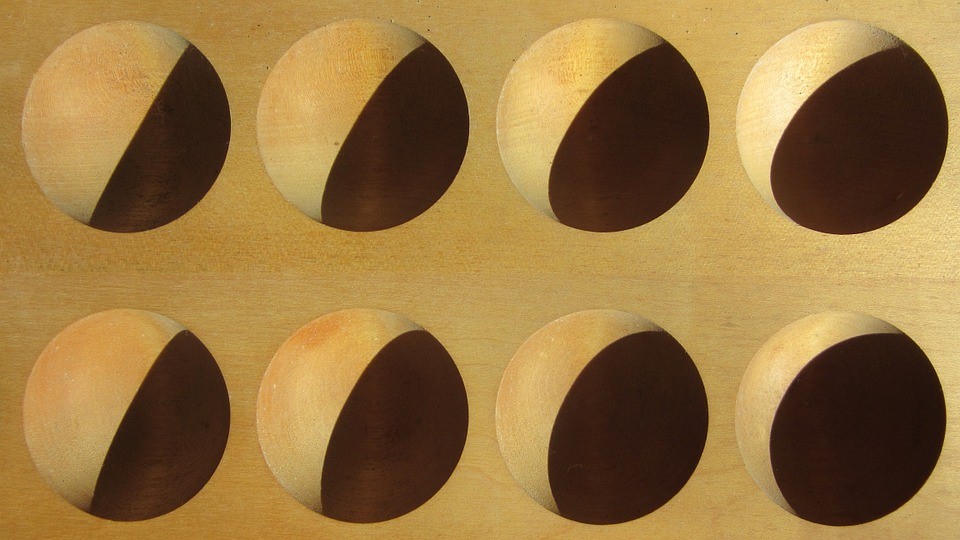
- Concave and convex positioning – this can be created through the use of shading.

Figure 3.4: Source: https://www.interaction-design.org/literature/article/preattentive-visual-properties-and-how-to-use-them-in-information-visualization (Author/Copyright holder: Pixabay. Copyright terms and licence: Free to Use)
The image uses shading to suggest convex/concave properties in the circles. These are then preattentively processed in the brain.
Now that we know what makes a good visualization, let’s have a look at some data visualization on climate change causes and evaluate their effectiveness of using preattentive attributes.
References
“Preattentive Visual Properties and How to Use Them in Information Visualization.” 2018. https://www.interaction-design.org/literature/article/preattentive-visual-properties-and-how-to-use-them-in-information-visualization.
